Table of Contents
This chapter tries to collect all other formatting options (and tricks) available in the library that doesn't really fit anywhere else
The library offers support to do basic linear regression analysis with the help of
the utility : class LinearRegression defined in the utility module
"jpgraph_utils.inc.php". With this class it is possible to
make a linear estimation of data and calculate some of the basic statistics of the
data, i.e. correlation coefficient and standard error.
The LinearRegression class is instantiated with the data to be
analyzed and it is then possible to both get hold of the statistics that corresponds
to the data and also to automatically calculate a range of estimated y-values for a
given set of x-coordinates.
The following code snippet shows how to instantiate a regression analysis with some data
1 2 3 4 5 6 7 8 9 10 11 12 13 14 15 16 17 18 19 | require_once( 'jpgraph_utils.inc.php') // Some data to be analyzed (both x, and y-data must be specified) $datay = array( ... ) ; $datax = array( ... ) ; // Instantiate the linear regression class $linreg = new LinearRegression($datax, $datay); // Get the basic statistics list( $stderr, $corr ) = $linreg->GetStat(); // Get a set of estimated y-value for x-values in range [0,20] list($x, $esty) = $linreg->GetY(0,20) ... |
The methods available in the LinearRegression class that can be used
are
-
LinearRegression::GetStat()Returns an array with (standard error, correlation coefficient, determination coefficient)
The closer the correlation coefficient is to 1 the more of the data variation can be explained by a linear estimate.
-
LinearRegression::GetAB()Return an array of the linear coefficients (a,b) where the linear estimation is y = a + b*x
-
LinearRegression::GetY($aMinX, $aMaxX, $aStep=1)Return an array with (xdata, ydata) corresponding to an x-range between x values in range [
$aMinX,$aMaxX] with steps of$aStep
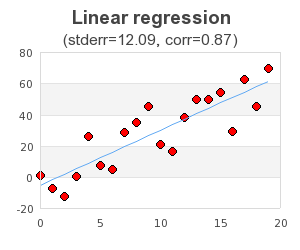
The following example shows how to use this utility class to plot both the original data as well as the estimated linear line.
Example 18.1. Linear regression using utility class (example16.6.php)
1 2 3 4 5 6 7 8 9 10 11 12 13 14 15 16 17 18 19 20 21 22 23 24 25 26 27 28 29 30 31 32 33 34 35 36 37 38 39 40 41 42 43 44 45 46 47 48 49 50 51 52 53 54 55 56 57 | // content="text/plain; charset=utf-8" require_once ('jpgraph/jpgraph.php'); require_once ('jpgraph/jpgraph_scatter.php'); require_once ('jpgraph/jpgraph_line.php'); require_once ('jpgraph/jpgraph_utils.inc.php'); // Create some "fake" regression data $datay = array(); $datax = array(); $a= 3.2; $b= 2.5; for($x=0; $x < 20; ++$x) { $datax[$x] = $x; $datay[$x] = $a + $b*$x + rand(-20,20); } $lr = new LinearRegression($datax, $datay); list( $stderr, $corr ) = $lr->GetStat(); list( $xd, $yd ) = $lr->GetY(0,19); // Create the graph $graph = new Graph(300,250); $graph->SetScale('linlin'); // Setup title $graph->title->Set("Linear regression"); $graph->title->SetFont(FF_ARIAL,FS_BOLD,14); $graph->subtitle->Set('(stderr='.sprintf('%.2f',$stderr).', corr='.sprintf('%.2f',$corr).')'); $graph->subtitle->SetFont(FF_ARIAL,FS_NORMAL,12); // make sure that the X-axis is always at the // bottom at the plot and not just at Y=0 which is // the default position $graph->xaxis->SetPos('min'); // Create the scatter plot with some nice colors $sp1 = new ScatterPlot($datay,$datax); $sp1->mark->SetType(MARK_FILLEDCIRCLE); $sp1->mark->SetFillColor("red"); $sp1->SetColor("blue"); $sp1->SetWeight(3); $sp1->mark->SetWidth(4); // Create the regression line $lplot = new LinePlot($yd); $lplot->SetWeight(2); $lplot->SetColor('navy'); // Add the pltos to the line $graph->Add($sp1); $graph->Add($lplot); // ... and stroke $graph->Stroke(); |