This is basically a free form blank canvas where any graphics can be drawn. Canvas graphs area also used as the basic graph for graphic tables as described in Chapter 19. Graphical tables
The library provides two module files to aid with this
"jpgraph_canvas.php" and
"jpgraph_canvtools.php". The second module is strictly speaking
not necessary but provides a number of utility classes that makes it much easier to work
with canvas.
Canvas graphs is provided as a layer to make is easier to create arbitrary images and still make use of some of the convenience methods available in the library (like font and color support).
Canvas graphs makes it easy to use the low level graphic drawing primitives in the library provided by the two classes
-
class ImageThis is the basic low level class that encapsulates the GD library by providing a complete framework for using graphic primitives with a coherent API and many convenience methods.
-
class RotImageThis is a descendant of class Image that in addition to the basic primitives also provides support for rotation of graphs
It is possible to work at different levels of abstraction when creating a canvas.
-
By only using the basic Image and RotImage classes. This can be considered one abstraction level above the most basic GD libraries
-
By making use of the functionality provided by
class
                            CanvasGraph
and the supporting classes (e.g.class CanvasScale). By using the canvas scale class it is possible to defining a coordinate grid on the canvas. These coordinates can then be used instead of absolute pixels which is necessary to us ethe basic Image and RotImage classes.
A concrete example of how canvas graphs can be used can be seen in Figure 8.1. List of all latin TTF fonts. ( where all the available fonts have been drawn on a
canvas.listfontsex1.php)
Creating a canvas gives you the opportunity draw arbitrary shapes on a "white" piece of paper. Let's first show a simple example were we just draw a text box.
Example 17.1. A simple canvas graph to draw a text box (canvasex01.php)
1 2 3 4 5 6 7 8 9 10 11 12 13 14 15 16 17 18 19 20 21 22 23 24 25 26 27 28 29 30 31 32 33 34 35 36 | // content="text/plain; charset=utf-8" // $Id: canvasex01.php,v 1.3 2002/10/23 08:17:23 aditus Exp $ require_once ('jpgraph/jpgraph.php'); require_once ('jpgraph/jpgraph_canvas.php'); // Setup a basic canvas we can work $g = new CanvasGraph(400,300,'auto'); $g->SetMargin(5,11,6,11); $g->SetShadow(); $g->SetMarginColor("teal"); // We need to stroke the plotarea and margin before we add the // text since we otherwise would overwrite the text. $g->InitFrame(); // Draw a text box in the middle $txt="This\nis\na TEXT!!!"; $t = new Text($txt,200,10); $t->SetFont(FF_ARIAL,FS_BOLD,40); // How should the text box interpret the coordinates? $t->Align('center','top'); // How should the paragraph be aligned? $t->ParagraphAlign('center'); // Add a box around the text, white fill, black border and gray shadow $t->SetBox("white","black","gray"); // Stroke the text $t->Stroke($g->img); // Stroke the graph $g->Stroke(); |

The example in Figure 17.22. A simple canvas graph to draw a text box ( starts by creating a 400x200
sized image. canvasex01.php)
The margins are then set to to get a frame around the image.
For canvases the margins has no effect in the way coordinates are entered. Top left is (0,0) and bottom right (including any potential margin and shadow) is the maximum. In this case the coordinate range are X:0-399, and Y:0-199
The InitFrame() method is then called which actually strokes the
margin and plotarea to the graph. Since everything is stroked in the order the
commands are given it is necessary to make sure that the graphical objects that
should be on top are stroked last. This is different from the other graph types
since they will hide these details and stroke the details in the graph in the
correct order.
We then create a Text object, setup it's properties, including the absolute screen position where we want the text, and then stroke it.
The Text::Align() method specifies the anchor point of the text as
explained in Chapter 8. Text and font handling
We also specify that the lines within the paragraph should be centered with a call
to Text::ParagraphAlign() Since we also choose to have a box around the
text we have to make use of the method Text::SetBox() which is used to
specify the fill color, the border color and the shadow color (if the shadow color
is set to '', no shadow will be used).
Now we are ready to stroke the text onto the canvas. In order to do so we must
specify the graphical context when stroking the text. The current graphic context is
always available in the "$img" property of the CanvasGraph
class.
This specification of the graphical context is needed to all Stroke method that is external to the main graph class.
A canvas also makes a good background for using standard graphic primitives, for example circles and lines. The first thing to remember is that this requires working with absolute screen coordinates and secondly that all drawing primitives are found in the Image Class accessible as a property of the Graph class.
This means that to draw a line between absolute coordinates (0,0) and (100,100) the following code must be created
1 | $graph->img->Line(0, 0, 100, 100); |
The following example shows how to create some basic graphic shapes on a canvas
Example 17.2. Drawing some basic geometric shapes on a canvas (canvasex02.php)
1 2 3 4 5 6 7 8 9 10 11 12 13 14 15 16 17 18 19 20 21 22 23 24 25 26 27 28 29 30 31 32 33 34 35 36 37 38 39 40 41 | // content="text/plain; charset=utf-8" // $Id: canvasex02.php,v 1.1 2002/08/27 20:08:57 aditus Exp $ require_once ('jpgraph/jpgraph.php'); require_once ('jpgraph/jpgraph_canvas.php'); // Setup a basic canvas we can work $g = new CanvasGraph(400,200,'auto'); $g->SetMargin(5,11,6,11); $g->SetShadow(); $g->SetMarginColor("teal"); // We need to stroke the plotarea and margin before we add the // text since we otherwise would overwrite the text. $g->InitFrame(); // Add a black line $g->img->SetColor('black'); $g->img->Line(0,0,100,100); // .. and a circle (x,y,diameter) $g->img->Circle(100,100,50); // .. and a filled circle (x,y,diameter) $g->img->SetColor('red'); $g->img->FilledCircle(200,100,50); // .. add a rectangle $g->img->SetColor('green'); $g->img->FilledRectangle(10,10,50,50); // .. add a filled rounded rectangle $g->img->SetColor('green'); $g->img->FilledRoundedRectangle(300,30,350,80,10); // .. with a darker border $g->img->SetColor('darkgreen'); $g->img->RoundedRectangle(300,30,350,80,10); // Stroke the graph $g->Stroke(); |
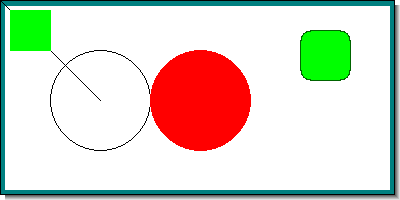
The previous method using absolute coordinates works. But it gives very little flexibility in, for example, scaling the image. Working with absolute coordinates is therefore not very practical and gets tedious for complex figures.
To mitigate these issues the library offers a convenience class, class
CanvasScale, this will allow the creation of a suitable scale that will
make it easier to both create and scale the graph.
In order to use a canvas scale the module
"jpgraph_canvtools.php" must first be included. In addition
to the canvas scale class this module also provides the companion Shape
class. This companion shape class is used to draw shapes using the specified scale
onto the canvas.
Using the scale is quite simple and requires only two steps
-
An instance of the scale class is first created with the CanvasGraph instance as the first parameter
-
The wanted scale is then specified with the wanted x and y scales
The following code snippet shows how this is done
1 2 3 4 5 6 7 8 9 10 11 | $graph = CanvasGraph(400,300); // ... other canvas formatting // Create a new scale $scale = new CanvasScale( $graph ); $scale->Set($xmin, $xmax, $ymin, $ymax); // ... |
The next step needed to be able to create geometric shapes is to create an instance of class Shape and give the canvas graph and the scale as the two parameters as the following line shows.
1 2 3 | $shape = new Shape($graph, $scale); |
It is now possible to create arbitrary geometric shapes by using the provided methods in the shape class. The shape class provides the following methods
-
Shape::SetColor($aColor) -
Shape::Line($x1,$y1,$x2,$y2) -
Shape::Polygon($p,$aClosed=false) -
Shape::FilledPolygon($p) -
Shape::Bezier($p,$aSteps=40) -
Shape::Rectangle($x1,$y1,$x2,$y2) -
Shape::FilledRectangle($x1,$y1,$x2,$y2) -
Shape::Circle($x1,$y1,$r) -
Shape::FilledCircle($x1,$y1,$r) -
Shape::RoundedRectangle($x1,$y1,$x2,$y2,$r=null) -
Shape::FilledRoundedRectangle($x1,$y1,$x2,$y2,$r=null) -
Shape::ShadowRectangle($x1,$y1,$x2,$y2,$fcolor=false,$shadow_width=null,$shadow_color=array(102,102,102)) -
Shape::SetTextAlign($halign,$valign="bottom") -
Shape::StrokeText($x1,$y1,$txt,$dir=0,$paragraph_align="left") -
Shape::
                                IndentedRectangle($xt,$yt,$w,$h,$iw=0,$ih=0,$aCorner=3,$aFillColor="",$r=4)
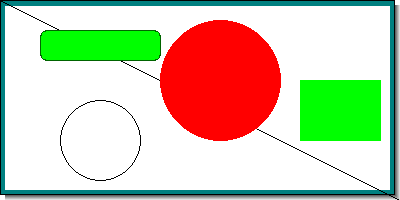
We can now show a complete example of using the shape class
Example 17.3. Creating a canvas graph with a scale and using the shape class (canvasex03.php)
1 2 3 4 5 6 7 8 9 10 11 12 13 14 15 16 17 18 19 20 21 22 23 24 25 26 27 28 29 30 31 32 33 34 35 36 37 38 39 40 41 42 43 44 45 46 47 48 49 50 51 52 53 54 55 56 57 | // content="text/plain; charset=utf-8" // $Id: canvasex03.php,v 1.1 2002/08/27 20:08:57 aditus Exp $ require_once ('jpgraph/jpgraph.php'); require_once ('jpgraph/jpgraph_canvas.php'); require_once ('jpgraph/jpgraph_canvtools.php'); // Define work space $xmax=20; $ymax=20; // Setup a basic canvas we can work $g = new CanvasGraph(400,200,'auto'); $g->SetMargin(5,11,6,11); $g->SetShadow(); $g->SetMarginColor("teal"); // We need to stroke the plotarea and margin before we add the // text since we otherwise would overwrite the text. $g->InitFrame(); // Create a new scale $scale = new CanvasScale($g); $scale->Set(0,$xmax,0,$ymax); // The shape class is wrapper around the Imgae class which translates // the coordinates for us $shape = new Shape($g,$scale); $shape->SetColor('black'); // Add a black line $shape->SetColor('black'); $shape->Line(0,0,20,20); // .. and a circle (x,y,diameter) $shape->Circle(5,14,2); // .. and a filled circle (x,y,diameter) $shape->SetColor('red'); $shape->FilledCircle(11,8,3); // .. add a rectangle $shape->SetColor('green'); $shape->FilledRectangle(15,8,19,14); // .. add a filled rounded rectangle $shape->SetColor('green'); $shape->FilledRoundedRectangle(2,3,8,6); // .. with a darker border $shape->SetColor('darkgreen'); $shape->RoundedRectangle(2,3,8,6); // Stroke the graph $g->Stroke(); |
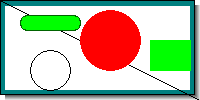
To show the usefulness of using the scale class Figure 17.25. Changing the image size to create a smaller version of the previous example ( shows the result after just changing the image size but keeping the code the
same. The relation between the shapes will remain the same but in a smaller format
to fit the new image size.canvasex04.php)
Figure 17.25. Changing the image size to create a smaller version of the previous example ( canvasex04.php)
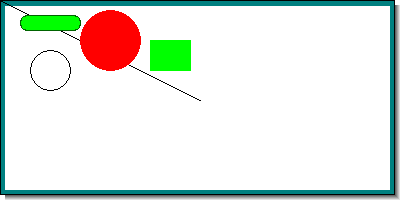
If we instead wanted to keep the image size but shrink the shapes we could just
make the scale twice as large which would result in Figure 17.26. Keeping the image size but changing the scale ( canvasex05.php)
We previously mentioned that the Shape class was a wrapper around the image class
with one exception. The exception is that it contains one additional method which
draws an "indented rectangle". An indented rectangle is a rectangle where one of
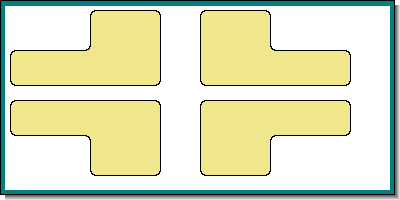
it's four corners have been moved into the rectangle Figure 17.27. Example of using an indented rectangle ( shows an example of using this shape.canvasex06.php)
As a final note we mention the utility class class
CanvasRectangleText This can be used to add a text with a rounded
rectangle (possibly filled) onto the canvas. Figure 8.1. List of all latin TTF fonts. (
where all the available fonts were shown were using this class. listfontsex1.php)