Error plots are used to visually indicate uncertainty in data points. This is done by specifying both a min and and max value for each data point.
Before error plots can be used the module "jpgraph_error.php"
must be included.
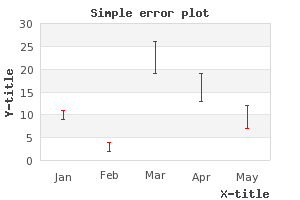
The following example illustrates a simple error bar. We will have 5 points, so we
need 10 Y-values. We also would like the error bars to be red and 2 pixels wide. All
this is accomplished by creating an instance of the ErrorPlot class in
much the same way as, for example, a normal line plot.
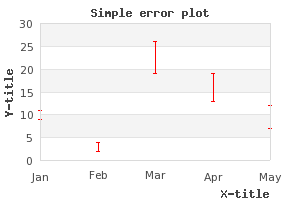
There is one displeasing esthetic quality of this graph. The X-scale is just wide enough to just accompany the number of error bars and hence the first bar is drawn on the Y-axis and the and last bar just at the edge of the plot area.
To adjust this we can use the method ErrorPlot::SetCenter() which
will adjust the x-scale so it does not use the full width of the X-axis.
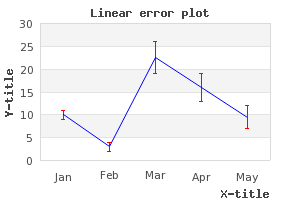
A variant of the error plot graph is to use an LineErrorPlot
instead. This is almost the same as the ErrorPlot but with the
added feature that each data point also has an middle value which a line is
drawn through. This can be thought of as a line plot combined with an error
plot.
Since this also uses a line the module "jpgraph_line.php"
must be included in addition to the error module.
To control the various properties of the line drawn the "line" property of the error line plot may be accessed. So, for example, to set the line to have weight of 2 pixels wide and with a blue color the following two lines are needed
1 2 3 4 | $elplot->line->SetWeight ( 2 ); $elplot->line->SetColor ( 'blue' ); |
An example of this is shown in Figure 15.60. A basic Line error plot ( . We could
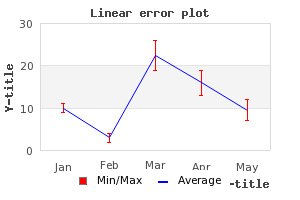
now also add a legend to none, one or both of the line types(the plain line
and/or the error bar). So for example if we wanted the legend "Min/Max" for the
red error bars and a legend "Average" for the blue line the following lines
should be addedexample15.php)
1 2 3 4 | $errplot->SetLegend ( 'Min/Max' ); $errplot->line->SetLegend ( 'Average' ); |
The result is shown in Figure 15.61. A line error plot with a legend ( example16.php)
|
|
|